Monday, 6 August 2012

SQL Tuning: Understand the problem you are going to solve

Problem:
Recently a report was handed over to me. It is to reconcile the trades received in our real time SWIFT messaging system with the data stored in the investment admin system. This report has to run two times per day, and requires near real time data.
During testing, we noticed that it took about two minutes for this report to complete. When this report was running with a lot of SWIFT messages fed into the system at the same time, some times we saw database timeout errors thrown out.
Analysis:
After taking a dig into this report, I found the bottleneck of the underlying SQL query was that it needs to retrieve records received during a certain date time range based on a field “ReceiveDateTime” in the message table. No index has been defined on this field, and it is something we do not want to do at all. Our messaging system is very busy especially during peak windows. Adding an index on this field will slow down the message persistence process, which was more than two times slower in our testing, whereas the performance gain of the report was only around 30 seconds less after adding the index.
What options can we have then?
Option:
A. Set up a reporting database using the SQL server transactional replication to have near real time data replicated from the production database to the reporting database. The report can then executed against the reporting database.
B. Further tuning of the underlying SQL query.
I tasked one team member to investigate option A. His testing shown that the transactional replication can replicate the changes within seconds. However, we do not have the luxury of setting up a standalone publishing server, which has to be set up on the same database server where a number of databases are hosted. We cannot tell what performance impact it will have on this server and on various applications without thorough testing. In addition, this report was developed to serve as a short-term solution. Do we really want to spend the time and effort required by this option for a one-off solution?
What is the real problem we are going to solve?
I asked myself, given a date time range, how can I retrieve the data from a database table quickly? As we all know, for a large amount of data, the cluster index seek operation is the most efficient way to select data. Is it possible for me to transform the problem of retrieving records within a date time range into a problem of looking for records given a start message ID and an end message ID? After examining the data at hand, the answer is YES.
The primary key of the message table, the message ID, is an auto-grown identity field. The "ReceiveDateTime" field is set at the time of inserting the message into the database table.  What does that mean? That means, the data we have are a set of ordered data by the primary key and the "ReceiveDateTime" field. The problem of searching records by "ReceiveDateTime" therefore can be translated into a problem of searching messages based on the message IDs.
For example, when asked to retrieve a range of data between "2012-07-01 08:00" and "2012-07-01 15:00", you are actually asked to search:
1. The start message ID with the receive date time being the closest to, >=, "2012-07-01 08:00".
2. The end message ID with the receive date time being the closest to, <=, "2012-07-01 15:00"
What is the classic search algorithm popping up in your mind when given a set of sorted data? To me, it's binary search. I then implemented in SQL a twisted version of the binary search algorithm to locate the closest message ID matching a given start date time, and the closest message ID matching a given end date time.
In my search, I do not want to search all the records stored in the table. I implemented the following to take a best guess of the start and end message ID at the very start before any binary search:
Given:
The average number of messages received per day: N.
The top 1 Message ID, hm, and ReceiveDateTime, hd, in descending order from the message table at the time of searching.
The top 1 Message ID, lm, and ReceiveDateTime, ld, in ascending order from the message table at the time of searching.
1. If the given start date time > hd, the start day is in the future, no point of doing any search. Return.
2. If the given start date time < ld, the start day is out of scope. Return.
3. If the given start date time = hd or the start date time = ld, bingo, return the message Id, hm or lm.
4. Calculate the difference D = the current day - the start date time in terms of day.
5. Take a guess of the start message ID = m - (D + 1) * N.
6. If the receive date time of the message ID <= the given start time, binary search the start message time with the message ID ranging between and m.
7. If the receive date time of the message ID > the given start time, take another guess till the message ID <= the given start time. Repeat 6 to locate the closest message ID matching the given start date time.
It is a very similar algorithm with a minor difference to locate the closest end message ID matching the given end date time.
After the change together with some other minor query changes, the improvement is dramatic - the running time of this SQL query has been reduced from around two minutes down to less than one second.

Wednesday, 1 June 2011

Garbage collection in Objective-C and C#

In C#, or more precisely CLR .Net, developers are freed from manually allocating and freeing the memory for managed objects. But for unmanaged resources, developers must dispose them explicitly, otherwise memory leaks. In Objective-C, it's very similar to C/C++, you must and must only release objects you create.

Both languages have implemented an automatic garbage collection mechanism with two different algorithms, Reference counting by Objective-C., and Mark-sweep-compact by CLR .Net.

In Objective-C, when an object is initialized, it has a reference count of 1. when it is retained by some other object, its reference count is incremented by 1. When it receives a release message, its reference count is decremented by 1. When the reference count of an object is 0, the system treats it as garbage and deallocates the memory it occupies. Reference counting is an algorithm easy to understand. Compared with other garbage collecting algorithms, one strong point of reference counting is that it won't suspend applications from running during garbage collection. Reference count is incremented or decremented while the application is running. Developers are responsible for maintaining the reference count of objects they create by sending retain or release/autorelease messages to the objects.

But when there are cyclical references among objects, reference counting does not quite work. To work around retain cycles, Objective-C introduces weak reference. For example, x holds a strong reference to y, while y has a weak reference to x. X cannot be deallocated if any other object holds a strong reference to it. But when no object has a strong reference to x, even though y has a weak reference to x, x can be deallocated. In CLR .Net there is also a weak reference type, which I will talk about it later.

CLR implements a generational mark and compact garbage collecting mechanism. Objects are allocated in an area called the managed heap. The managed heap is different from the native C runtime heap in that it is a reserved continuous block of memory. Traditionally, objects are scattered in the native heap wherever the system can find a spot that is large enough to hold an object. The managed heap is continuous and hence it is really fast to allocate space for new objects. The managed heap is divided into 3 sections, generation 0, 1 and 2. CLR has a NextObjPtr pointer to keep track of where to put the next object. Each generation has a size limit. The size is not fixed. The garbage collector collects the statistics of your application and adjusts the size of each generation as it goes.

Now let's look at how the garbage collector works. When a method in your application gets executed, primitive types are stored in the stack. Reference types are created in Generation 0 on the managed heap. The NextObjPtr gets updated and point to the next available spot. When the method finishes execution, the stack gets cleaned up right away, but the reference types are not. The garbage collector does not deallocate reference types until Generation 0 is filled. How does it know? It could be a test against a threshold value, or the NextObjPtr points beyond Generation 0. The garbage collector will then kicks in and starts marking. It starts from the reference objects used in the current method, the so called roots, traverse to build a reference graph of all other objects referenced by the roots - they are marked as reachable objects. All non-reachable objects are treated as garbage and deallocated. Cyclical reference of objects is not an issue here. As long as these objects are not referenced by a root object, they are deemed as unreachable and will be swept. Any objects survived in the sweep are then compacted and promoted to Generation 1.

When garbage collector kicks in, all running threads are suspended so that garbage collector can analyse the managed heap and build the reference graph. When objects are compacted and moved, all pointers to these moved objects are updated to point to the new addresses by the garbage collector.

Once the garbage collection completes, the application resumes running. New objects are allocated in Generation 0. When Generation 0 is filled, garbage collector starts again. Will it clean up Generation 1? It all depends on if Generation 1 is filled or not. If not, garbage collector will not examine Generation 1. The fact may be that the objects stored in Generation 1 are not used any more and are truly rubbish, but garbage collector will leave them in memory unless Generation 1 is running out. The garbage collector will then work on Generation 1. Objects survived the collection in Generation 1 are compacted and promoted to Generation 2. Again, the garbage collector only cleans up Generation 2 when Generation 2 is filled. Survived objects in Generation 2 just stay in Generation 2. The idea of generational garbage collecting is to improve performance because examing all generations each time is expensive. The garbage collector may not compact objects each run. If the gap in memory is small, it will not compact to save the effort of moving objects around and updating the references to these objects.

So we can see some of the ideas behind the garbage collecting mechanism in CLR .Net:
1. The newer the object the shorter its life cycle might be.
2. The older the object the longer it tends to stay.
3. The more continuous the available space in the heap, the faster to allocate new objects.
4. The fewer generations to examine, the faster the garbage collecting runs.

Similar to Objective-C, .Net has a WeakReference type. E.g. these types can be referenced by other objects but that does not prevent them from being deallocated by the garbage collector. The WeakReference type may be used in a caching mechanism. But since garbage collection is not deterministic and may be more frequent than one would expect, it may not be a good way of implementing caching.

In summary, Objective-C encourages developers to leave as few memory prints as they could. While the desinger of CLR .Net believes memory management is not an easy task and therefore should be taken over by the system - performance can be sacrificed for the sake of safety.

Sunday, 10 April 2011

Programming objective-C/Cocoa frameworks on Windows 1 - Install GNUStep and Hello World

I have started exploring the possibility of programming objective-c with Cocoa frameworks on Windows over the weekend.

Objective-C is a super set of C. All native C code can be compiled down by an objective-c compiler. If I only want to play with objective-C the programming language without the Cocoa frameworks provided by Apple, a standard gcc compiler is enough.

To program in objective-C and play with the Cocoa frameworks on my Windows 7, I need to install GNUStep for Windows. GNUStep not only provides an objective-C compiler but also a robust implementation of the foundation, AppKit, and UIKit libraries in the Cocoa frameworks. Developers can program with Cocoa frameworks on many platforms using GNUStep. It is a good tool to give the apple a bite.

To get started, download the GNUStep windows installers and install them in the following order:
  • gnustep-msys-system-0.22.1-setup.exe
  • gnustep-core-0.22.0-setup.exe
  • gnustep-devel-1.0.0-setup.exe
  • ProjectCenter-0.5.0-setup.exe
After installation:


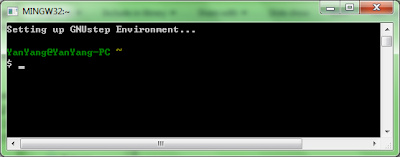
Click Shell and a MinGW window starts:


I can't wait to say "Hello world!".

Start NotePad++, create a Helloworld.m file.

#import <foundation foundation.h>
int main (void)
{
    NSLog(@"Hello world!");
    return 0;
}

Create a GNUMake file in the same directory.

include $(GNUSTEP_MAKEFILES)/common.make

TOOL_NAME = HelloWorld
HelloWorld_OBJC_FILES = helloworld.m

include $(GNUSTEP_MAKEFILES)/tool.make

From the shell window, navigate to my source file folder and type "make". My first application is built.


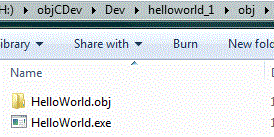
After the "make" commad, a sub folder "obj" has been created with the following items:


To run the Helloworld.exe, in the shell window, type "obj/Helloworld" and you'll see the "Hello world!" greeting in the shell window.

The above is not a very exciting example. How about changing the code and play with AppKit a bit:

#import <foundation foundation.h>
#import <appkit.h>
int main (void)
{
  NSAutoreleasePool *pool = [NSAutoreleasePool new];
  [NSApplication sharedApplication];
  NSRunAlertPanel (@"Test", @"Hello world!", nil, nil, nil);
  [pool drain];
  return 0;
}

The GNUMake file will also need to be modified:

include $(GNUSTEP_MAKEFILES)/common.make

APP_NAME = HelloWorld
HelloWorld_OBJC_FILES = helloworld.m

include $(GNUSTEP_MAKEFILES)/application.make

In the shell window, type "make clean" to cleanup the previous make, then "make".
To run the application, type "OpenApp Helloworld", and a message box will pop up:


Now I have a development environment and a running application - good progress!

Thursday, 31 March 2011

Quotes to share among software developers

I have been migrating a functionality from VB6 to .Net code. Tasks like this can be tricky. Normally, the original developer is no longer around left behind him/her a piece of code with no documentation about the business rules - they are hidden gems to be discovered.

I started reading the code. Anyway, the code is the best documentation a developer can have. The frustrating bit is that the main method printed out to be 5 double sided A4 pages. FIVE double sided pages of code for a single method! Every time I see code like this, I want to cry it out - could you mighty developer have some sympathy towards those who end up maintaining your great piece of work? Could you at least cut it into shorter methods with meaningful names (function names and variable names)?

Quotes like the following should be shared among developers. Something I'd love to remind myself from time to time so that people who picks up my work later won't want to kill me. I admit that sometimes I couldn't understand my own code in couple of months time, but I promise that I won't write a single method lasts for pages and pages ;).

Always code as if the person who ends up maintaining your code will be a violent psychopath who knows where you live.
-- [source]


... nearly everybody is convinced that every style but their own is ugly and unreadable. Leave out the "but their own" and they're probably right...
--Jerry Coffin (on indentation) [source]


If you need more than 3 levels of indentation, you're screwed anyway, and should fix your program.
--Linux 1.3.53 CodingStyle documentation [ source]


It's OK to figure out murder mysteries, but you shouldn't need to figure out code. You should be able to read it.
--Steve McConnell [ source]


If the code and the comments disagree, then both are probably wrong.
--attributed to Norm Schryer  [source]


If you have a procedure with ten parameters, you probably missed some.
--[source]

 
Why do we never have time to do it right, but always have time to do it over?
--Anonymous [ source]


Computers are high-speed idiots, programmed by low-speed idiots
-- [source]


Wednesday, 16 March 2011

How to move a borderless window

I had to display a warning message sitting on top of all other windows. I created a borderless form and pinvoked a windows API function in my C# code to achieve this.

However, I found that I couldn't move the borderless window using the mouse. The border actually responds to all resize and position messages. To move a borderless window, the following is needed.

Two API methods:
[DllImport("user32.dll")]
public static extern bool ReleaseCapture();

[DllImport("user32.dll")]
public static extern IntPtr SendMessage(IntPtr hWnd, int msg, int wParam, int lParam);

Handle the mouse down event in the borderless window:
private const int WM_NCLBUTTONDOWN = 0xA1;
private const int HT_CAPTION = 0x2;
 private void borderlessWindow_MouseDown(object sender, MouseEventArgs e)
  {
            if (e.Button == MouseButtons.Left)
            {
                ReleaseCapture();
                SendMessage(this.Handle, WM_NCLBUTTONDOWN,  (IntPtr)HT_CAPTION, IntPtr.Zero);
            }
 }

Saturday, 12 March 2011

SQL Error Severity and Level Cheat Sheet

Sometimes I have to raise errors manually inside a stored procedure. It will be handy to have an error severity cheat sheet.

Code Description
1 - 9Informational messages/warnings.
10N/A. @@ERROR won't be set.
11 - 16Regular programming errors. Level 16 is not more serious than 11
11Specified Database Object Not Found
12Unused
13User Transaction Syntax Error. E.g. deadlock.
14Insufficient Permission
15Syntax Error in SQL Statements
16Miscellaneous User Error
17Run out of a configurable resource, such as locks
18Nonfatal internal software problems
19Nonconfigurable resource limit has been exceeded
20An error with a statement issued by the current process
21SQL Server has encountered a problem that affects all the processes in a database
22A table or index has been damaged
23The integrity of the entire database is affected and the database will be marked suspect
24Hardware problem
25System error

Monday, 7 June 2010

C#: Per-process CPU Usage and Network IO Tracking using PerformanceCounter

I have been tacking per-process CPU percentage and Network IO data bytes in my recent project using System.Diagnostics.PerformanceCounter class. I felt the online materials I found does not explain the usage of the PerformanceCounter very well.

Some basics about PerformanceCounter.
1. A performance category has many performance counters underneath. A performance counter may be single-instanced or contain multiple running instances. The structure is like this:
PerformanceCategory
    -- PerformanceCounter
        -- Instances
To get all the built-in categories:
PerformanceCategory.GetCategories()

To get all the counters under the category that has exactly one running instance:
PerformanceCategory.GetCounters()

2. The constructor to create a performance counter is:
PerformanceCounter(string categoryName, string counterName, string instanceName.

To monitor the IO (file or network) data bytes sent/received by FireFox:
PerformanceCounter counter = new PerformanceCounter("Process", "IO Data Bytes/sec", "firefox");

To monitor the CPU percentage used by FireFox:
PerformanceCounter counter = new PerformanceCounter("Process", "% Processor Time", "firefox");

3. To take a sample and get the calculated value:
counter.NextValue();
Before calling this method, make sure you wait for at least one second.
counters.Add(new PerformanceCounter("Process", "IO Data Bytes/sec", "firefox"));
counters.Add(new PerformanceCounter("Process", "% Processor Time", "firefox"));

System.Threading.Thread.Sleep(1000);

foreach(PerformanceCounter counter in counters)
        Console.WriteLine(string.Format("{0}:{1}}, counter.CounterName, counter.NextValue());

Some lessons I have learned:
1. The calculated value of the first sample is always 0. E.g. the very first time you call NextValue(), the returned value is always 0.

2. If an application has more than one running instances, even though from the Task Manager, these running instances all have the same process name, E.g. "TestProcess", their instance names are not the same. The instance started first has its name as "TestProcess", the second "TestProcess#1", the third "TestProcess#2"...the nth, "TestProcess#n". So make sure the right instance name gets passed into the performance counter constructor.

3. If any of the running instances of the same application exits, the instance names will be changed. If your code doesn't update the instance name accordingly, an "Instance not found" error will occur.

E.g. If "TestProcess" of the 2 running instances, "TestProcess" and "TestProcess#1", stopps running, "TestProcess#1" will be renamed to "TestProcess". If the counter still has the name "TestProcess#1", it will throw an exception when NextValue() is called. The instance name can be updated by simply calling counter.InstanceName = "new instance name".

4. In my case, I am only interested in getting per-Process statistics. Unfortunately, the PerformanceCounter does not operate against the process id. To get around this limitation, I have created my own wrapper class called ProcessPerformanceCounter.
public class ProcessPerformanceCounter
{
    ...
    public ProcessPerformanceCounter(string counterName, int processId) {...}
    public string CounterName {get{...}}
    public string InstanceName {get{...} set{...}}
    public NextValue(){...}
}

Based on the process id, I can get the process name. I can then get all running processes under the same name. From there, I can get the correct instance name for that particular process:
private string GetInstanceName(int processId)
{
        string instanceName = GetProcessNameById(processId);
        bool found = false;
        if (!string.IsNullOrEmpty(instanceName))
        {
                Process[] processes = Process.GetProcessesByName(instanceName);
                if (processes.Length > 0)
                {
                        int i = 0;
                        foreach (Process p in processes)
                        {
                                instanceName = FormatInstanceName(p.ProcessName, i);
                                if (PerformanceCounterCategory.CounterExists("ID Process","Process"))
                                {
                                        PerformanceCounter counter = new PerformanceCounter("Process", "ID Process", instanceName);

                                        if (processId == counter.RawValue)
                                        {
                                                found = true;
                                                break;
                                        }
                                }
                                i++;
                        }
                }
        }

        if (!found)
                instanceName = string.Empty;

        return instanceName;
} 
 
private string FormatInstanceName(string processName, int count)
{
        string instanceName = string.Empty;
        if (count == 0)
                instanceName = processName;
        else
                instanceName = string.Format("{0}#{1}", processName, count);
        return instanceName;
} 
 
5. When calling counter.NextValue(), do not forget to handle the instance name changed scenario:
public float NextValue()
{
        float nextValue = 0;
        try
        {
                nextValue = counter.NextValue();
        }
        catch (Exception ex)
        {
                if (InstanceNotExistError(ex))
                {
                        // adjust instance name based on process id
                        instanceName = GetInstanceName(processId);
                        counter.InstanceName = instanceName;
                        nextValue = counter.NextValue();
                }
                else
                        throw;
        }

        return nextValue;
}